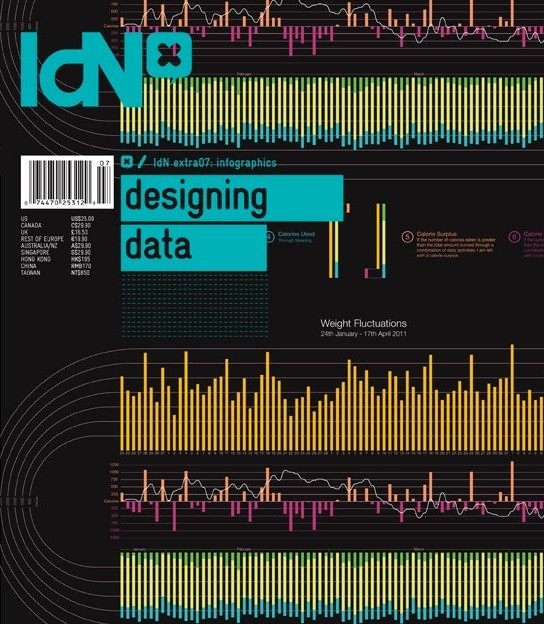
IdN Extra 07 - Infographics - Designing data
When a database becomes a thing of beautyInfographics or information graphics are visual representations of information, data or knowledge. They...
Leer más...
When a database becomes a thing of beautyInfographics or information graphics are visual representations of information, data or knowledge. They are often used when complex information needs to be presented as quickly and effectively as possible, such as signs and maps. Infographics can be as simple as a bar chart or a pie graph to represent percentages in business information; or as elaborative as some of the examples in this book to communicate stories in newspapers and magazine.Infographics can be entertaining when the information they represent is of personal interest; but it is especially fun and challenging when the topic may be as dry as representing concepts in technical manuals or scientific statics.How do you get people to notice and absorb data that may in itself be quite mundane but that it is necessary for them to know, as well as making it beautiful? In this special issue, we present more than 120 examples of this all-important design genre. Featuring: Aalejandro Diazs Alexandra Hayes Athletics Barnbrook Ben Willers Binalogue Carolina Andreoli Chris Bishop Ciaran Hughes Density Design Draught FFunction Filip Chudzinski Finn Fitzsimons Francesco Franchi Francesco Zorzi Hyperakt Inksurge Jax de Leon Josh Nimoy Julian Hansen Kelli Anderson Lauren Manning Leigh Leigh Mash Creative Mathew Lucas Michael Paukner Michael Deal numalab Section Design Peter Orntoft Rayz Ong RodrigoMachado Rory Pickering MIT Senseable City Lab Shelby White Socio Design studioooij Tamer Koseli Tanya Test Luxury Of Protest Tien Min Liao Tiffany Farrant Gonzalez Toby Ng
Autor@: VV.AA.
ISBN: 978-988-15-9502-7
Encuadernación: TB - Tapa blanda
Idioma: Inglés
Agotado


")


